Statistical Analysis
Test for Binomial Data:
Chi-square test: Tests for binomial data are just as powerful and useful as test for normally distributed data. This test applies for two treatments and is equivalent to an ANOVA. Here we for significant differences among treatments.
Pearson's Chi-squared test
data: chitab
X-squared = 174.202, df = 18, p-value < 2.2e-16
2-sample test for equality of proportions with continuity correction
data: xtab
X-squared = 12.806, df = 1, p-value = 0.0001728
alternative hypothesis: less
95 percent confidence interval:
-1.0000000 -0.1860294
sample estimates:
prop 1 prop 2
0.4516129 0.8260870
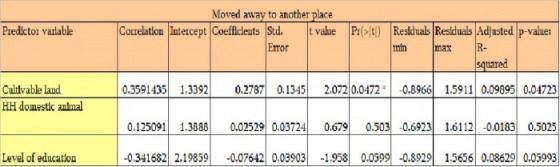
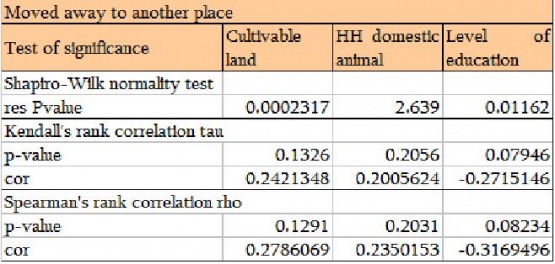
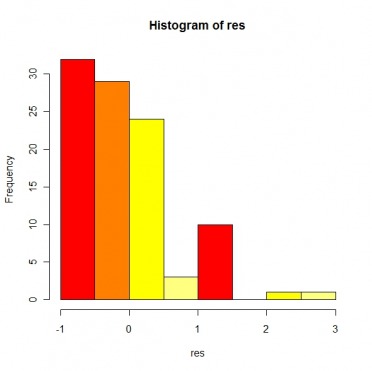
Homogeneity of variance and normality in Y for a given X value can be best be explored with residual plots. In above, I plotted the land size in katha with respect to migration decision.
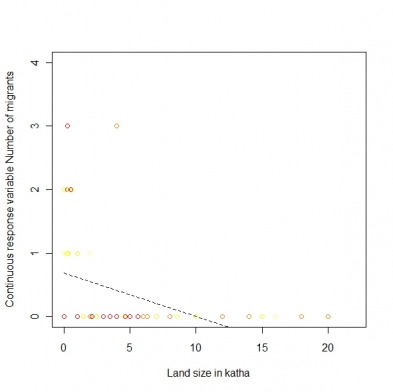
In above graph, we can see the negative relationship with migration decision and cultivable land size. Those who have more cultivable land, they are unlikely to be stay in the village rather than migration.
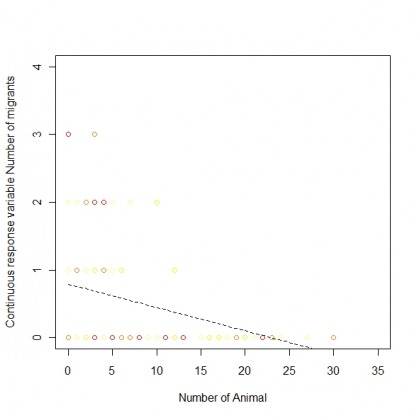
In above graph, we can see the negative relationship with migration decision and number of domestic animal. Those who have more domestic animal in the household, they are more likely to be stay in the village rather than migration.
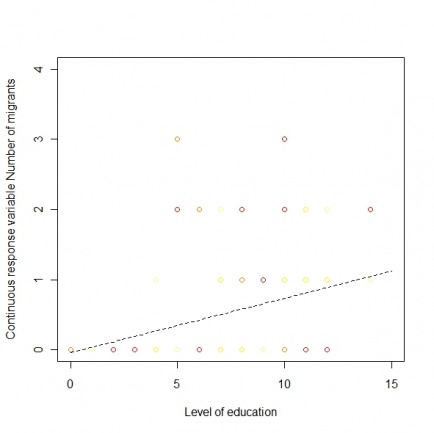
In above graph, we can see the positive relationship with migration decision and level of education in household. Those who have more education in the household by completing more than class 10, they are more likely to migrate in another place for better living where they will able to find a good job for them.
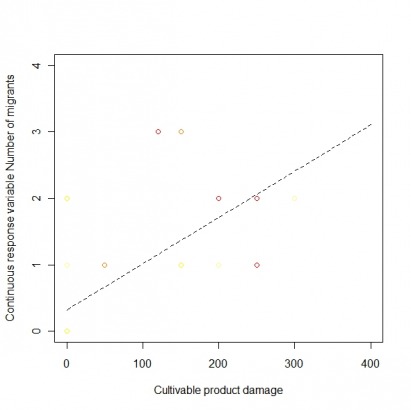
In above graph, we can see the positive relationship with migration decision and any cultivable product damage in household. Those who have cultivable product damage in the household, they are more likely to migrate in another place for surviving where they will able to find a earning way for them.
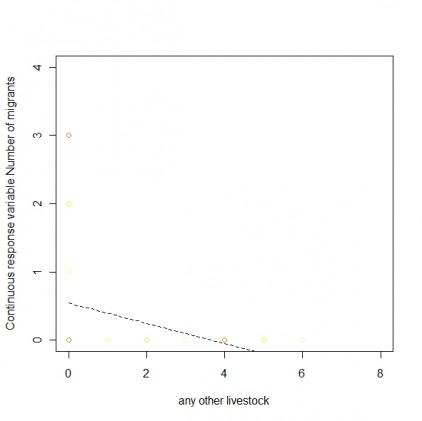
In above graph, we can see the negative relationship with migration decision and number of any other livestock. Those who have more livestock animal in the household, they are more likely to be stay in the village rather than migration.
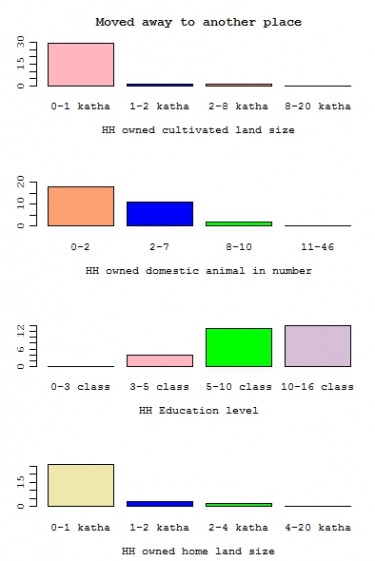
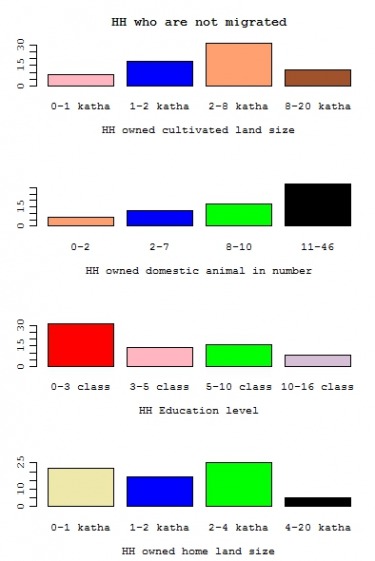
Those who are migrated from one place to another they have less HH owned cultivable land, less HH owned domestic animal, higher level of education, less HH owned home land. On the other hand, those who are not migrated they have higher level of HH owned cultivable land, higher HH owned domestic animal, higher HH owned home land, less level of education.

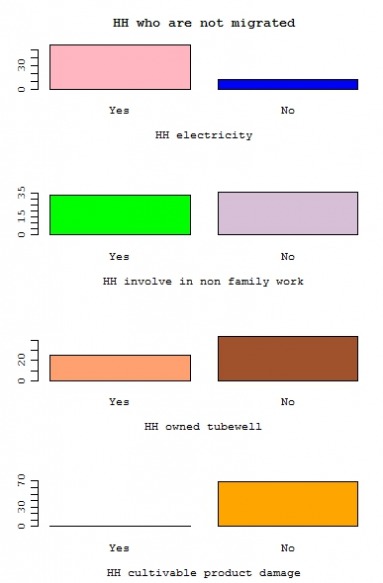
Those who are migrated from one place to another they have less HH electricity, more involve HH non family work, higher level of education, or may cultivable land damage. On the hand, those who are not migrated they have higher HH electricity, less involve HH non family work, less level of education.
